Note on Transparency: This article was generated with the assistance of Artificial Intelligence to provide a comprehensive and up-to-date overview of the discussed topic.
The Phantom Bug: When Code is Clean, But Business Metrics Still Suffer
Imagine this: You're staring at a dashboard, eyes scanning the vital signs of your business. Suddenly, a key metric — conversion rate, customer retention, average order value — takes a nosedive. Panic sets in. You rally the engineering team, scour the logs, and pore over code repositories. But the more you look, the more frustratingly clear it becomes: there are no bugs. The code is pristine, the servers hum, and every technical test passes with flying colors. So, why are your business metrics bleeding?
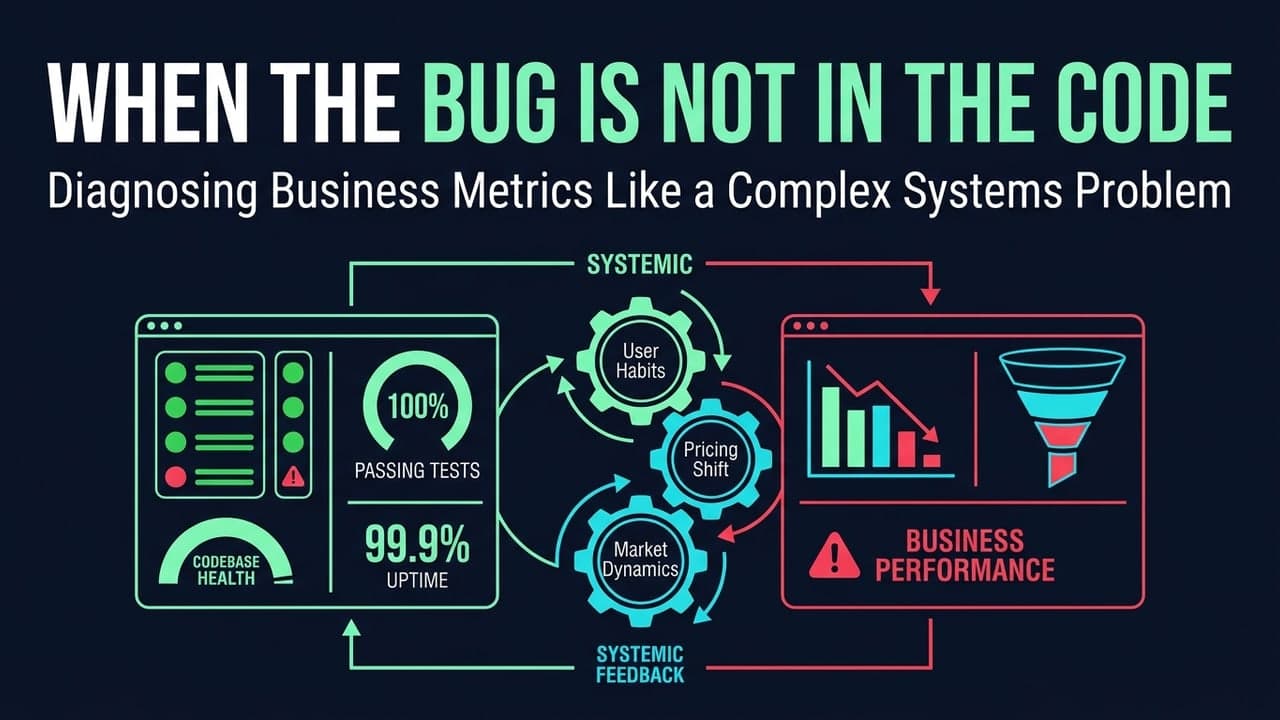
This familiar frustration is a common pitfall in our tech-driven world. We're wired to look for technical faults, to debug our way out of problems. But what happens when the problem isn't a line of faulty code, but an invisible glitch in the intricate machinery of your organization itself? This is where the "systems problem" mindset becomes not just useful, but essential. It's about looking beyond the neatly packaged code and seeing your entire business as a living, breathing system.
Traditional debugging, while powerful for software, often falls short in complex organizational landscapes because it's designed to fix explicit errors within defined parameters. Business performance, however, is a mosaic of human behavior, strategic decisions, market forces, inter-departmental interactions, and customer psychology. You can't put a breakpoint on a misaligned sales incentive or log the exact moment a customer feels neglected. To truly understand and improve performance, we need a new lens for diagnosing business metrics.
Beyond the Dashboard – Understanding Metrics as System Outputs
The first step in this new diagnostic journey is to challenge the myth of the isolated metric. It’s easy to look at a number on a dashboard and treat it as an independent entity, a score that simply needs to be "boosted." But every single number you see — whether it's daily active users, bounce rate, or lead-to-opportunity conversion — is a reflection of a deeper, often unseen, organizational reality. Think of a metric not as the disease itself, but as a symptom. Just as a fever indicates an infection, a drop in conversion indicates something deeper happening within your business.
At its core, any business operates as a complex system, continuously processing inputs (like customer demand, raw materials, or marketing spend) through various processes (sales workflows, product development, customer support, internal communication) to produce outputs (products, services, customer satisfaction, and, critically, your business metrics). Understanding these components and their intricate relationships is paramount. If you change an input or tweak a process, it will inevitably ripple through the system, affecting the outputs.
These systems are also dynamic, powered by feedback loops. Consider a new pricing strategy (an input) that aims to increase revenue (an output). If successful, this might free up resources for better customer support (a process improvement), leading to higher customer satisfaction, which then loops back to drive even more sales. But what if the new pricing alienates a key customer segment? That negative feedback loop could spiral, leading to churn and eventually a decline in the very revenue you sought to increase. Unintended consequences are the natural offspring of complex systems. By shifting our perspective to view metrics as mere symptoms, we move from the reactive urge to "treat the number" to a more strategic approach of diagnosing business metrics by understanding the underlying condition of the entire system.
The Systems Analyst's Lens – Deconstructing Business Problems
To effectively navigate this intricate web, we need to adopt the mindset of a systems analyst. This means mapping the invisible architecture of your organization. It's about asking, "What causes what?" and "How does this part of the business influence that part?" This mapping often involves frameworks that help us visualize organizational dynamics, making abstract relationships concrete.
One powerful tool for this is a Causal Loop Diagram (CLD). Imagine your business as a series of interconnected pools and pipes. A CLD helps you draw those pools (variables like "Customer Satisfaction" or "Marketing Budget") and the pipes that connect them (the cause-and-effect relationships). Arrows show influence, and symbols indicate whether that influence is reinforcing (a positive loop that amplifies change) or balancing (a negative loop that stabilizes things). For instance, a CLD might reveal that while increased marketing spend boosts leads, an understaffed sales team then bottlenecks those leads, causing frustration and a poor conversion rate, which then reduces the effective return on marketing spend. This unearths the true drivers and dampeners of your metric performance.
Once you’ve mapped these connections, you can identify leverage points. These are the critical junctures within the system where a small, well-placed intervention can yield disproportionately large and positive results. Instead of blindly pushing buttons, you're now targeting the fulcrum that can move mountains. This analytical approach also sharpens our ability to distinguish correlation from causation. Just because two metrics move in the same direction doesn't mean one causes the other. Systems thinking encourages us to look for the true causal links, often hidden beneath layers of assumptions, helping us avoid misattributions that lead to wasted effort. This is crucial for precise diagnosing business metrics.
Case Files: Unmasking the True Culprits Behind Troubled Metrics
Let's dive into some common scenarios where "bugs" aren't in the code, but in the system itself.
The Churn Enigma
Your product is rock solid, customer support tickets are low, and yet, customer retention is inexplicably declining. You've checked the code – no issues!
The Systemic Culprit: Often, this is a classic case of misaligned sales incentives. If sales teams are primarily rewarded for acquiring new customers, they might prioritize quantity over quality, bringing in customers who aren't a good long-term fit or making promises the product can't keep. Post-sales support might also be under-resourced or lack integration with the sales team, leaving new customers feeling abandoned after the initial hype. Competitive market shifts, not reflected in product features, can also quietly erode loyalty.
# Conceptual data points to investigate churn causes beyond code
# This isn't a fix, but an analytical approach to diagnosing the problem.
customer_data_sample = [
    {"customer_id": "C001", "product_score": 9, "sales_incentive_type": "acquisition_focused", "onboarding_satisfaction": 6, "churned": True},
    {"customer_id": "C002", "product_score": 8, "sales_incentive_type": "retention_bonus", "onboarding_satisfaction": 9, "churned": False},
    {"customer_id": "C003", "product_score": 9, "sales_incentive_type": "acquisition_focused", "onboarding_satisfaction": 7, "churned": True},
    {"customer_id": "C004", "product_score": 7, "sales_incentive_type": "balanced", "onboarding_satisfaction": 8, "churned": False},
]

# We would analyze 'sales_incentive_type' and 'onboarding_satisfaction'
# correlations with 'churned' status to identify systemic patterns.
The Conversion Conundrum
Users are dropping off your conversion funnel at an alarming rate, and the design team swears the UI is intuitive and bug-free.
The Systemic Culprit: A "bad UI" is often a convenient scapegoat. The real issue might be a fragmented customer journey. Perhaps users are encountering inconsistent messaging between marketing materials and the product itself, or there are too many steps, confusing redirects, or demands for irrelevant information. An unclear value proposition at critical stages can also lead to abandonment – users don't understand "what's in it for them" at each commitment point.
// Conceptual tracking of customer journey events for systemic analysis
// Focuses on drop-off points and user paths, not UI bugs.
const userJourney = [
    { userId: "U001", event: "Homepage_Visit", timestamp: "T1" },
    { userId: "U001", event: "Product_View", timestamp: "T2" },
    { userId: "U001", event: "Added_to_Cart", timestamp: "T3" },
    { userId: "U001", event: "Checkout_Page_Load", timestamp: "T4" },
    { userId: "U001", event: "Payment_Method_Selection_Attempt", timestamp: "T5" },
    { userId: "U001", event: "Checkout_Abandoned_Reason: 'Confusing payment options'", timestamp: "T6" }, // Key insight here
];

// Analyzing common abandonment reasons or sudden drop-offs helps pinpoint
// systemic friction points in the overall journey.
The Productivity Paradox
Your development or operations teams report high individual efficiency, but project delivery dates keep slipping. Morale might even be good, yet things just aren't getting done.
The Systemic Culprit: This often points to inter-departmental communication breakdowns or resource contention. Teams might be operating in silos, unaware of upstream dependencies or downstream impacts. Ambiguous strategy from leadership can also mean teams are working diligently on projects that don't align, or they frequently shift priorities, causing context switching overhead. The actual "work" isn't the problem; the flow of work is.
# Conceptual representation of project dependencies and cross-team blockers
# Helps in diagnosing productivity bottlenecks that aren't code-related.
project_tasks = {
    "feature_x_dev": {"team": "frontend", "dependencies": ["api_integration"]},
    "api_integration": {"team": "backend", "dependencies": ["db_schema_update"]},
    "db_schema_update": {"team": "devops", "dependencies": []},
    "marketing_campaign_prep": {"team": "marketing", "dependencies": ["feature_x_dev"]},
}

# Analyzing blocked tasks and cross-team dependencies reveals systemic communication
# or resource allocation issues that hinder overall velocity.
The Revenue Rollercoaster
Your sales figures are wildly unpredictable, not tracking with market trends or seasonal demands. There's no major technical outage, yet the numbers bounce like a rubber ball.
The Systemic Culprit: Inconsistent internal operational processes are often to blame. This could be a fluctuating lead qualification process, where different sales reps apply varying criteria, leading to a pipeline full of unqualified leads. Or perhaps the sales team struggles to articulate the value proposition effectively to diverse customer segments, leading to inconsistent closing rates. Unaddressed shifts in customer needs, not reflected in product or marketing, can also cause erratic performance.
# Conceptual sales pipeline analysis to diagnose systemic issues
# Not a bug fix, but a tool for uncovering operational inconsistencies.
sales_deals = [
    {"deal_id": "D001", "stage": "qualified_lead", "rep": "Alice", "status": "stalled_no_response"},
    {"deal_id": "D002", "stage": "proposal_sent", "rep": "Bob", "status": "negotiating"},
    {"deal_id": "D003", "stage": "qualified_lead", "rep": "Alice", "status": "closed_lost_pricing"},
    {"deal_id": "D004", "stage": "new_lead", "rep": "Charlie", "status": "disqualified_mismatch_criteria"},
]

# Analyzing deal status, sales rep performance, and disqualification reasons
# helps in diagnosing inconsistent processes or training gaps.
Code Fix vs. Systemic Solution: A Tale of Two Diagnostic Paths
When faced with a problem, our natural inclination, especially in tech, is to go for the quick fix.
The "Code Fix" Mentality
This approach is reactive and tactical. It sees a symptom (e.g., "customer churn is up") and attempts to address it directly and narrowly (e.g., "let's send a re-engagement email to churning customers"). This often leads to a "whack-a-mole" scenario, where you fix one problem only for another, related issue to pop up elsewhere. It's like putting a band-aid on a gaping wound – it might stop the immediate bleeding, but it doesn't address the underlying injury. While necessary for actual software bugs, it's insufficient for diagnosing business metrics effectively.
The "Systemic Solution" Approach
In contrast, the systemic approach is proactive and strategic. It involves stepping back, mapping the entire relevant system, and asking: "Why is churn happening in this specific way? What are the root causes? Which elements of our organization are contributing to this outcome?" This path leads to sustainable change, because it addresses the core issues, not just their surface manifestations.
Here's a quick comparison:
| Feature | "Code Fix" Mentality | "Systemic Solution" Approach |
|---|---|---|
| Focus | Symptoms, immediate problems | Root causes, entire system |
| Nature | Reactive, tactical, often isolated | Proactive, strategic, integrated |
| Effort | Often quick, but may require repeated effort | More upfront effort, deeper investigation |
| Outcome | Short-term relief, "whack-a-mole" problem-solving | Long-term resilience, sustainable improvement |
| Impact | Localized, may create new issues elsewhere | Holistic, improves overall system health |
Just as technical debt accrues from shortcuts in code, organizational debt accumulates from unresolved systemic issues like inefficient processes, unclear roles, or misaligned incentives. Both types of debt hinder future progress, slow down innovation, and add hidden costs that only surface when your key metrics start to suffer.
So, when is it a code bug? A genuine code bug is an error in the software itself – a broken calculation, a server crash, an API endpoint returning incorrect data. A systemic breakdown, however, might manifest as a technical "bug" report, but the underlying issue isn't software functionality. For example, users might report a "bug" that they can't complete a complex form. The form technically works, but its length, confusing field labels, or mandatory irrelevant information is a systemic flaw in user experience or process design, not a coding error. This distinction is vital for accurate diagnosing business metrics and choosing the right intervention.
Building Resilient Businesses: Embracing a Systems Approach to Metric Health
Ultimately, the goal isn't just to fix problems, but to build resilient businesses that can adapt and thrive. This requires a fundamental shift in how we approach performance and challenges.
First, it demands cultivating a diagnostic culture. This means empowering every team member, from engineers to marketers, to think like a systems analyst. It's about asking "why?" multiple times, challenging assumptions, and actively investigating the interconnectedness of issues rather than simply addressing the most obvious symptom. This fosters a shared responsibility for holistic business health.
Second, it necessitates implementing a continuous feedback loop. This isn't just about collecting data; it's about actively monitoring both technical and business metrics, establishing mechanisms for regular review, and, most importantly, adapting processes and strategies based on what you learn. This allows you to proactively adjust, course-correct, and prevent minor systemic issues from escalating into major business crises.
Finally, the ultimate evolution is to move from reactive problem-solving to proactive system design. Instead of constantly reacting to declining metrics, you begin to intentionally design your organizational structures, workflows, incentive programs, and communication channels to foster the desired outcomes from the outset. This forward-thinking approach transforms your business from a collection of isolated parts into a cohesive, self-improving whole, intrinsically optimized for robust metric health. By embracing a systems approach, you unlock the true power of diagnosing business metrics and build a foundation for sustainable growth.
The Five Whys, Applied to Software Incidents