Note on Transparency: This article was generated with the assistance of Artificial Intelligence to provide a comprehensive and up-to-date overview of the discussed topic.
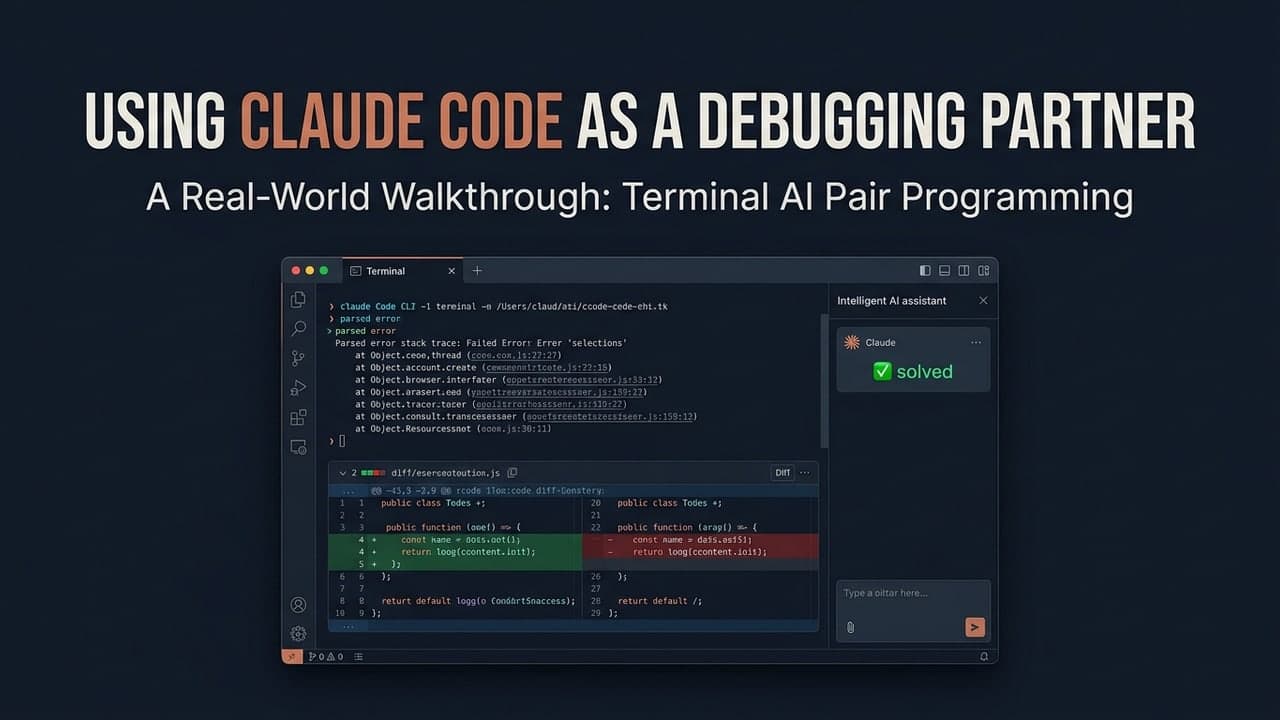
Claude Code works as a debugging partner by reasoning over the code, logs, and error messages you give it to diagnose why a bug happens — a complement to an IDE debugger, which is better at showing where it happens through live execution and variable inspection. It can't run your code or access a live environment itself, so it's most effective paired with the concrete evidence (a stack trace, a log line, a failing test) that a traditional debugger or logging already surfaced.
The Debugging Dilemma: Embracing a New Ally
The Inevitable Frustration: Why Debugging Dominates Developer Time
Picture this: you've just poured hours into crafting a beautiful piece of software, watched it compile without a hitch, and then... bam. An unexpected error, a subtle miscalculation, or a feature that just doesn't quite work. Welcome to the world of debugging. It’s an omnipresent, often infuriating, and undeniably time-consuming aspect of software development. Developers, regardless of their experience level, spend a significant portion of their work hours—sometimes 35-50%—locked in a battle against elusive bugs. This isn't just a minor annoyance; it leads to project delays, increased costs, and can be a major source of developer burnout. As systems grow in complexity, becoming intricate webs of microservices and dependencies, pinpointing the root cause of an issue feels less like a science and more like an archaeological dig in the dark.
Enter AI: A Paradigm Shift in Problem Solving
But what if you didn't have to tackle this alone? What if you had an incredibly intelligent, tireless assistant by your side, ready to listen, analyze, and suggest solutions? This is precisely the paradigm shift ushered in by advanced Artificial Intelligence models, particularly Large Language Models (LLMs) like Claude. These aren't just fancy autocomplete tools; they're sophisticated systems capable of understanding complex programming logic, synthesizing vast amounts of information, and generating human-like explanations. When applied to the thorny problem of debugging, AI offers a truly transformative potential: accelerating diagnosis, proposing elegant fixes, and even unearthing subtle issues that might elude a human developer. It's not about automation replacing human ingenuity; it's about augmentation, giving developers superpowers.
What This Walkthrough Will Uncover
This isn't just theory. In this comprehensive walkthrough, we're going to roll up our sleeves and explore the practical application of using Claude Code debugging partner capabilities. We’ll dive deep into Claude's specific strengths in code analysis and problem-solving, guiding you on how to craft effective prompts and engage in an iterative dialogue. A detailed, step-by-step example will vividly illustrate how to leverage Claude to diagnose and fix a tricky logic error in a Python script. Furthermore, we’ll compare AI-assisted debugging with traditional methods, discuss Claude's broader utility in proactive bug hunting and code review, and critically examine its current limitations. By the end, you'll have a clear roadmap for integrating Claude into your own development workflow, turning debugging frustration into efficient, collaborative problem-solving.
Forging the Partnership: Understanding Claude's Debugging Prowess
Claude's Core Strengths: Contextual Understanding, Language Generation, and Code Reasoning
Claude, developed by Anthropic, is more than just a chatbot; it's a sophisticated AI designed for engaging in thoughtful, nuanced conversations. This design ethos translates directly into its impressive capabilities as a Claude Code debugging partner. Its core strengths form the bedrock of its utility for developers:
- Contextual Understanding: Imagine trying to understand a complex novel by reading only isolated sentences. Impossible, right? Similarly, code debugging requires a holistic view. Claude excels here, processing and synthesizing large blocks of text—including entire code snippets, verbose error messages, and even project documentation. It can grasp the broader context of a bug, understanding not just individual lines, but how different functions, classes, and modules interact. This allows it to connect a traceback (the detailed log of function calls leading to an error) to the specific logic within a function and the data flowing through it, often pinpointing the actual culprit rather than just its symptom.
- Language Generation: A powerful debugger doesn't just find problems; it explains them clearly and proposes solutions. Claude's ability to generate coherent, articulate language means it can explain intricate technical concepts, detail the root cause of an error, articulate potential solutions, and even rewrite or optimize code snippets. This transforms cryptic error messages into clear, actionable insights.
- Code Reasoning: This is where Claude truly shines beyond simple syntax checks. It can infer the intent behind your code, identify logical inconsistencies, and predict how your program will behave given certain inputs. This is invaluable for diagnosing subtle logic errors that don't crash your program but lead to incorrect outputs—think off-by-one errors, incorrect conditional logic, or unexpected side effects. Claude's focus on being "helpful, harmless, and honest" also means it strives to provide reliable and accurate code analysis, a crucial attribute for any debugging partner.
The Art of the Debugging Prompt: Guiding Claude Effectively
Interacting with an AI debugger like Claude is less about clicking buttons and more about crafting precise, informative prompts. It’s a skill, an art even, that combines clarity, specificity, and an understanding of how to "think" with the AI.
Providing Sufficient Context: Code, Error Messages, Intended Behavior
The golden rule for effective AI-assisted debugging is simple: the more context Claude receives, the more accurate and helpful its responses will be. When you encounter a bug, arm Claude with:
- The relevant code snippet(s): Don't be shy. Include the function, class, or module where the issue lies, along with any directly interacting components.
- Complete error messages or stack traces: Copy-paste the entire output. These often contain critical clues, like specific line numbers, error types, and the sequence of calls that led to the failure.
- Description of the intended behavior: Clearly articulate what the code should be doing. What output do you expect? What state should the application be in? This helps Claude distinguish between a true bug and merely unexpected-but-valid behavior.
- Actual observed behavior: Detail precisely what the code is doing. Is it crashing? Returning the wrong value? Getting stuck in a loop? Be specific.
# My Python script calculates averages after filtering non-positive values.
# When run with data = [-1, 0, 5, 10, -3, 2], it gives "Result: 4.25".
# Expected behavior: filter out -1, 0, -3, leaving [5, 10, 2], avg (17/3) = 5.666...
# The current result (4.25) seems to include 0.0.

def calculate_filtered_average(data_list):
    positive_numbers = []
    for num in data_list:
        if num >= 0: # This seems to be the problematic line, including 0
            positive_numbers.append(num)

    if not positive_numbers:
        return 0

    total = sum(positive_numbers)
    average = total / len(positive_numbers)
    return average

data = [-1, 0, 5, 10, -3, 2]
result = calculate_filtered_average(data)
print(f"Result: {result}")
Asking Incisive Questions: Beyond "Fix This"
Vague requests like "fix this code" are a shortcut to vague answers. Instead, engage your Claude Code debugging partner with specific, probing questions that direct its powerful analytical engine:
- "Given this input, why is this
ZeroDivisionErroroccurring?" - "Could there be an off-by-one error in this loop's boundary conditions?"
- "This API call returns a 403 Forbidden error. Can you suggest three possible reasons, considering my provided
headersandbody?" - "Are there any edge cases where this
ifcondition might lead to unexpected behavior?"
Iterative Dialogue: The Conversational Nature of AI-Assisted Debugging
Debugging with Claude is rarely a one-shot deal. It's a dynamic, conversational, and iterative process, much like collaborating with a human expert.
- Start Broad, Then Narrow: Begin with the core problem, and based on Claude's initial insights, ask follow-up questions or provide more specific details.
- Clarify and Probe: If an explanation is unclear, ask Claude to elaborate, simplify, or provide a different analogy.
- Test and Report: Implement Claude's suggested fixes and immediately report back the results—positive or negative. This feedback loop is crucial for Claude to refine its understanding and hypotheses.
- Provide New Data: As you gather more diagnostic information (from new test runs, logs, or external documentation), share it with Claude. This allows it to adjust its internal model of the problem.
Setting the Stage: Environment and Best Practices for AI-Assisted Debugging
To get the most out of your Claude Code debugging partner:
- Use a Secure Environment: Always be mindful of data privacy. While public AI models are generally secure, avoid sharing highly sensitive or proprietary code, customer data, or security credentials unless absolutely necessary and with appropriate safeguards.
- Organize Your Context: Keep all relevant code, error messages, and problem descriptions logically grouped within your prompt.
- Break Down Complexity: If a bug spans multiple files or complex system interactions, focus Claude on a single component or specific aspect of the issue at a time. You can then synthesize the findings.
- Verify Everything: AI can sometimes "hallucinate" or provide plausible-sounding but incorrect solutions. Always rigorously test Claude's suggested fixes in your actual development environment before committing or deploying.
- Understand Its Limits: Claude is a sophisticated pattern matcher and reasoner, but it doesn't "understand" in the human sense. It cannot execute code, inspect live memory, or access your local debugger. Its insights are derived solely from the textual information you provide.
A Real Walkthrough: Unraveling a Stubborn Bug with Claude Code
Let's put theory into practice. We'll simulate a debugging session, demonstrating the iterative process of identifying and resolving a tricky logic error with Claude.
The Scenario: A Subtle Logic Error in a Python Data Processing Script
Our mission: fix a Python script designed to process sensor data, specifically temperature readings. The function process_temperature_data is supposed to apply a calibration factor, filter out invalid readings, and calculate an average. The problem is subtle: our sensor occasionally reports 0.0 during startup, which should be treated as an invalid reading and excluded. However, the current logic is inadvertently processing it, leading to a skewed average.
Initial (Buggy) Code:
import statistics

def process_temperature_data(readings, calibration_factor, min_valid_temp, max_valid_temp):
    """
    Processes a list of raw temperature readings.
    Applies calibration, filters invalid readings, and calculates the average.

    Args:
        readings (list[float]): Raw temperature readings.
        calibration_factor (float): Factor to multiply each reading by.
        min_valid_temp (float): Minimum acceptable temperature (inclusive).
        max_valid_temp (float): Maximum acceptable temperature (inclusive).

    Returns:
        float: The average of the valid, calibrated temperature readings,
               or 0.0 if no valid readings are found.
    """
    calibrated_readings = []
    for reading in readings:
        calibrated_reading = reading * calibration_factor
        calibrated_readings.append(calibrated_reading)

    valid_readings = []
    for temp in calibrated_readings:
        # The bug: Should exclude 0.0 as an invalid startup reading under specific conditions
        if min_valid_temp <= temp <= max_valid_temp:
            valid_readings.append(temp)

    if not valid_readings:
        return 0.0 # No valid readings

    return statistics.mean(valid_readings)

# Test Cases
raw_data_1 = [20.0, 21.0, 19.0, 20.5]
# Expected: All valid. Average approx 20.125 * 1.0 = 20.125
print(f"Test 1 (Expected ~20.125): {process_temperature_data(raw_data_1, 1.0, 15.0, 30.0)}")

raw_data_2 = [0.0, 20.0, 21.0, 19.0, 20.5, -5.0] # 0.0 and -5.0 are invalid
# Expected: -5.0 excluded, 0.0 *should* be excluded but isn't.
# If 0.0 is excluded, valid = [20.0, 21.0, 19.0, 20.5] * 1.0, avg ~20.125
# If 0.0 is included (current bug), valid = [0.0, 20.0, 21.0, 19.0, 20.5] * 1.0, avg = 16.1
print(f"Test 2 (Expected ~20.125, Actual with bug ~16.1): {process_temperature_data(raw_data_2, 1.0, 0.0, 30.0)}")

raw_data_3 = [0.0, 0.0, 0.0]
# Expected (if 0.0 excluded): 0.0 (because sum is 0, len is 3, avg is 0.0) - this one is tricky.
print(f"Test 3 (Expected 0.0): {process_temperature_data(raw_data_3, 1.0, 0.0, 30.0)}")
Initial Symptom Identification and First Attempts (Pre-Claude)
The developer runs the tests and immediately notices Test 2 gives 16.1, but the expected average should be 20.125. They review raw_data_2 = [0.0, 20.0, 21.0, 19.0, 20.5, -5.0] and the parameters min_valid_temp=0.0, max_valid_temp=30.0. The -5.0 is correctly filtered out, as it's below the min_valid_temp. However, 0.0 is not filtered, because 0.0 <= 0.0 <= 30.0 is true. A quick print(temp) inside the loop confirms this.
The core problem becomes clear: the condition min_valid_temp <= temp <= max_valid_temp isn't enough because a 0.0 reading, while numerically within the range, is semantically invalid for a startup reading. How do we exclude only these specific 0.0s without accidentally excluding legitimate 0.0 temperature readings if they were possible? This is the subtle nuance a human might ponder for a while. This is where our Claude Code debugging partner comes in.
Step-by-Step with Claude:
Sharing the Code and Initial Error Trace: Our First Prompt
The developer decides to engage Claude. They provide the code, the test cases, and a clear description of the discrepancy and their understanding of the problem.
Prompt 1 (Developer to Claude):
I'm debugging a Python script that processes temperature sensor data, and I'm seeing an unexpected average calculation. The issue seems to be with how invalid readings are filtered.

Here's my function and some test cases:

```python
import statistics

def process_temperature_data(readings, calibration_factor, min_valid_temp, max_valid_temp):
    calibrated_readings = []
    for reading in readings:
        calibrated_reading = reading * calibration_factor
        calibrated_readings.append(calibrated_reading)

    valid_readings = []
    for temp in calibrated_readings:
        if min_valid_temp <= temp <= max_valid_temp:
            valid_readings.append(temp)

    if not valid_readings:
        return 0.0

    return statistics.mean(valid_readings)

# Test Cases
raw_data_1 = [20.0, 21.0, 19.0, 20.5]
print(f"Test 1 (Expected ~20.125): {process_temperature_data(raw_data_1, 1.0, 15.0, 30.0)}")

raw_data_2 = [0.0, 20.0, 21.0, 19.0, 20.5, -5.0]
print(f"Test 2 (Expected ~20.125, Actual with bug ~16.1): {process_temperature_data(raw_data_2, 1.0, 0.0, 30.0)}")

raw_data_3 = [0.0, 0.0, 0.0]
print(f"Test 3 (Expected 0.0): {process_temperature_data(raw_data_3, 1.0, 0.0, 30.0)}")
The problem is with
raw_data_2. The0.0reading, which comes from a sensor startup, should be considered invalid and excluded, even though it falls withinmin_valid_temp = 0.0andmax_valid_temp = 30.0. Currently, it's being included in the average, leading to an incorrect result.How can I modify the
valid_readingsfiltering logic to specifically exclude0.0values while still respecting themin_valid_tempandmax_valid_temprange?
Analyzing Claude's First Insights: Understanding Its Hypotheses
Claude quickly identifies the specific problem and offers a direct solution.
Claude's Response 1 (Simulated): "It looks like you've correctly identified the core issue: the
0.0value from sensor startup needs to be treated as an invalid reading, even when it falls within the generalmin_valid_tempandmax_valid_temprange.Your current filtering condition
min_valid_temp <= temp <= max_valid_tempis inclusive and naturally includes0.0ifmin_valid_tempis0.0or less.To specifically exclude
0.0values, you need to add an additional condition to your filtering logic. You can modify theifstatement to explicitly check iftempis not equal to0.0.Here's how you could modify the
valid_readingsloop:valid_readings = [] for temp in calibrated_readings: if min_valid_temp <= temp <= max_valid_temp and temp != 0.0: # Added condition valid_readings.append(temp)This ensures that any
0.0reading, regardless of whether it technically falls within the min/max range, is filtered out.Let me know if you test this and it resolves the issue, or if you have any follow-up questions!"
Refining the Problem: Providing More Test Data and Expected Outputs
The developer tests Claude's suggestion. It works for Test 2! But then a new thought emerges: what if 0.0 could be a legitimate temperature reading in a different context?
Prompt 2 (Developer to Claude):
Claude, that's a good initial thought and it does fix `Test 2`!

Test 1: 20.125
Test 2: 20.125 (Correct!)
Test 3: 0.0 (Correct, as all 0.0s are now excluded, leading to an empty list, returning 0.0)

However, I've just realized a subtle problem. What if a legitimate temperature reading *could* be `0.0` degrees Celsius (or Kelvin, adjusted to 0.0 after calibration) and should be included? My current requirement is only that *startup* `0.0`s are invalid.

Is there a way to make this exclusion more specific, perhaps only when `min_valid_temp` is also `0.0`? Or if the `0.0` is clearly an outlier compared to other readings?

For example, if `min_valid_temp = -10.0` and a `0.0` reading comes in that IS valid, I want to include it. But if `min_valid_temp = 0.0` and `0.0` comes in, I want to exclude it. This is getting complex.

Could you suggest a more robust way to handle this, perhaps considering the context of `min_valid_temp` itself?
Collaborative Code Review: Claude Highlights Potential Edge Cases
Claude, acting as our Claude Code debugging partner, brilliantly recognizes the new constraint and proposes a conditional exclusion.
Claude's Response 2 (Simulated): "You've raised an excellent point about the ambiguity of
0.0readings! It's crucial to differentiate between an invalid startup0.0and a legitimately measured0.0.The key insight here is that the special exclusion of
0.0is only relevant whenmin_valid_tempis also0.0. Ifmin_valid_tempis, for instance,-10.0, then a0.0reading would naturally fall within the valid range and shouldn't be specially excluded.Here's a refined approach for your filtering logic:
    valid_readings = []
    for temp in calibrated_readings:
        is_within_range = (min_valid_temp <= temp <= max_valid_temp)
        is_startup_zero = (temp == 0.0 and min_valid_temp == 0.0) # Only exclude 0.0 if min_valid_temp is also 0.0

        if is_within_range and not is_startup_zero:
            valid_readings.append(temp)
Explanation of the changes:
is_within_range: This variable encapsulates your original range check for clarity.is_startup_zero: This new variable specifically identifies the problematic0.0scenario:
temp == 0.0: Checks if the reading itself is zero.min_valid_temp == 0.0: Checks if the lower bound of your valid range is also zero. This is the condition that makes a0.0reading ambiguous (and thus, in your scenario, invalid).- Combined Condition:
if is_within_range and not is_startup_zero:
- A reading must first be within the general valid range.
- AND it must not be the specific 'startup zero' case we want to exclude.
This logic makes the exclusion of
0.0conditional on yourmin_valid_tempparameter, providing the flexibility you need. This is a good example of how understanding the 'why' behind a bug's requirement helps in crafting a more precise solution.Would you like to test this with your existing cases and perhaps a new one where
min_valid_tempis negative and0.0should be included?"
Arriving at the Solution: Testing and Verification
The developer implements Claude's refined logic and adds a new test case (raw_data_4) to verify the subtle edge case.
Modified Code (Final Solution):
import statistics

def process_temperature_data(readings, calibration_factor, min_valid_temp, max_valid_temp):
    calibrated_readings = []
    for reading in readings:
        calibrated_reading = reading * calibration_factor
        calibrated_readings.append(calibrated_reading)

    valid_readings = []
    for temp in calibrated_readings:
        is_within_range = (min_valid_temp <= temp <= max_valid_temp)
        is_startup_zero = (temp == 0.0 and min_valid_temp == 0.0) # The refined bug fix

        if is_within_range and not is_startup_zero:
            valid_readings.append(temp)

    if not valid_readings:
        return 0.0

    return statistics.mean(valid_readings)

# Test Cases
raw_data_1 = [20.0, 21.0, 19.0, 20.5]
print(f"Test 1 (Expected ~20.125): {process_temperature_data(raw_data_1, 1.0, 15.0, 30.0)}")
# Output: Test 1 (Expected ~20.125): 20.125

raw_data_2 = [0.0, 20.0, 21.0, 19.0, 20.5, -5.0]
print(f"Test 2 (Expected ~20.125): {process_temperature_data(raw_data_2, 1.0, 0.0, 30.0)}")
# Output: Test 2 (Expected ~20.125): 20.125 (0.0 is now correctly excluded due to min_valid_temp being 0.0)

raw_data_3 = [0.0, 0.0, 0.0]
print(f"Test 3 (Expected 0.0): {process_temperature_data(raw_data_3, 1.0, 0.0, 30.0)}")
# Output: Test 3 (Expected 0.0): 0.0

# New Test Case: 0.0 is a legitimate reading because min_valid_temp is negative
raw_data_4 = [0.0, 5.0, 10.0]
print(f"Test 4 (Expected 5.0): {process_temperature_data(raw_data_4, 1.0, -10.0, 100.0)}")
# Output: Test 4 (Expected 5.0): 5.0 (0.0 is correctly included because min_valid_temp is -10.0)
Success! All test cases now pass, and the subtle edge case is handled robustly.
Key Lessons from the Debugging Session: Prompt Efficacy and Iterative Discovery
This simulated session with our Claude Code debugging partner highlights critical lessons:
- The Power of Detailed Context: Providing the initial buggy code, concrete test cases, and clear descriptions of expected vs. actual outputs was paramount for Claude to grasp the problem accurately.
- Prompting for Precision: Asking incisive questions, such as "how can I specifically exclude
0.0under these conditions?", moved the conversation beyond a generic "fix it" to a targeted problem-solving approach. - Iterative Refinement is Crucial: The debugging process wasn't a single query. The initial fix was good, but the subsequent dialogue, introducing a new constraint (legitimate
0.0s), led to a more robust and complete solution. This mirrors the iterative nature of real-world debugging. - Claude as a Thinking Partner: Claude didn't just spit out code; it explained the why behind its suggestions, detailing how the proposed logic addressed the nuanced requirements. This fosters a deeper understanding for the developer, turning a problem into a learning opportunity.
- Human Validation is Paramount: The developer's role in critically testing Claude's suggestions and providing feedback (e.g., "it fixes Test 2, but creates a new problem for
Test 4") was indispensable. AI augments, it doesn't replace, human oversight.
Claude's Broader Role: Beyond the Fix and In Comparison
Claude's utility as a Claude Code debugging partner extends far beyond simply patching identified bugs. It serves as a versatile tool that significantly enhances traditional development practices and offers an interesting contrast to existing debugging methodologies.
Complementing Traditional Tooling: When and How Claude Enhances
IDE Debuggers vs. Claude: Different Tools for Different Facets
Think of debugging tools as specialized instruments in a doctor's kit. Each has a specific purpose.
| Feature | IDE Debuggers (e.g., VS Code, PyCharm) | Claude (LLM Debugging Partner) |
|---|---|---|
| Primary Strength | Runtime analysis: Step-by-step execution, variable inspection, breakpoint management. Excels at where an error occurs and the immediate state leading to it. | Static analysis & conceptual reasoning: Code interpretation, logical flaw detection, solution proposal. Excels at why a bug exists, suggesting design patterns, and explaining complex interactions. |
| Interaction Mode | Interactive, visual, real-time code execution. | Conversational, textual, analytical. |
| Access to Data | Direct access to live memory, call stack, execution flow. | Limited to text provided (code, logs, error messages). |
| Best Use Cases | Identifying exact line of crash, inspecting variable values at specific points, tracing complex execution paths. | Diagnosing subtle logic errors, architectural flaws, misunderstanding of APIs, code review, exploring alternative solutions, explaining complex code. |
| Analogy | A meticulous detective at the crime scene, collecting physical evidence. | A brilliant consultant, offering hypotheses and explanations based on all available textual reports. |
Enhancement: The optimal workflow often involves both. Use your IDE debugger to narrow down the location of a bug to a specific function. Then, feed that function's code, relevant variable states, and your observations to Claude for reasoning about why the logic might be flawed or to brainstorm alternative implementations.
Logging and Print Statements: Providing Claude with Data Points
Logging and print statements are the workhorses of debugging, spewing out variable values and execution paths.
- Traditional Use: Developers manually insert these statements to trace execution and observe data flow, often leading to a "forest of print statements."
- Complementing Claude: The output from robust logging or strategic print statements provides crucial "data points" for Claude. Instead of just stating "the average is wrong," providing detailed logs like "at line X,
filtered_listwas[0.0, 5.0, 10.0]but it should have been[5.0, 10.0]" gives Claude concrete, factual evidence. It transforms abstract problem descriptions into precise observations that Claude can analyze with greater accuracy.
Rubber Duck Debugging, Evolved: An Articulate and Insightful Partner
Rubber duck debugging—explaining your code line-by-line to an inanimate object—is a time-honored tradition. The act of articulating the problem often helps the developer identify the bug themselves.
- Claude's Evolution: Claude elevates this concept dramatically. Instead of a silent listener, it's an articulate and insightful partner. It can ask clarifying questions, propose alternative mental models, challenge your assumptions, and directly suggest solutions. It's like having an experienced senior developer available 24/7, not just to listen, but to actively participate in your thought process.
Proactive Bug Hunting: Using Claude for Code Review and Refactoring Suggestions
Claude isn't just for reactive firefighting; it's a powerful tool for proactive quality assurance.
- Code Review: Provide Claude with a new code module or function and ask it to "review this code for potential bugs, edge cases, performance issues, or security vulnerabilities." Claude can often identify common anti-patterns, subtle logic flaws, or areas where input validation might be insufficient, mimicking the insights of a human peer reviewer.
Example Prompt: "Review this Python function for a financial transaction. Are there any potential issues with input validation, concurrency, or security (e.g., injection risks)?"
- Refactoring Suggestions: When code becomes unwieldy or difficult to maintain, Claude can propose refactoring strategies. It can suggest ways to break down monolithic functions, improve naming conventions, apply appropriate design patterns, or optimize algorithms for better performance.
Example Prompt: "This
process_datafunction is getting very long and complex. Can you suggest ways to refactor it into smaller, more manageable functions, or propose a more Pythonic approach?"
Real-World Scenarios for Claude as a Debugger:
Frontend Challenges: Diagnosing State Management Issues in a React Application
- Scenario: A React component isn't updating correctly after an API call. The backend confirms data is updated, and Redux DevTools show the store is modified, but the UI remains stale.
- Claude's Role: You provide the component's code, relevant state management logic (e.g., Redux reducer, Context API), and the observed behavior ("Component X isn't re-rendering, but global state Y has changed"). Claude can analyze
useEffectdependencies,useStatesetters, or selector logic to pinpoint why the component isn't reacting to the state change. It might highlight direct mutations of state objects (a common React anti-pattern) instead of immutable updates.
Backend Quandaries: Pinpointing Performance Bottlenecks in a Node.js API
- Scenario: A Node.js API endpoint is experiencing high latency, but there are no crashes or obvious error messages. Profiling tools suggest time spent within a specific handler function.
- Claude's Role: Provide the endpoint handler code, any associated database query snippets, and the performance observation ("latency spikes to 5 seconds when
GET /usersis called with >1000 users"). Claude can analyze the code for synchronous I/O operations blocking the event loop, inefficient database queries (like N+1 problems), or unoptimized data processing loops, suggesting fixes likePromise.allfor concurrent operations or database indexing.
Infrastructure Glitches: Debugging Misconfigured Cloud Functions (e.g., AWS Lambda, Azure Functions)
- Scenario: An AWS Lambda function is failing with a generic permission error or timeout after deployment, even though the code runs perfectly locally.
- Claude's Role: Provide the Lambda function code, its
serverless.ymlor CloudFormation configuration, the IAM role policy, and the specific error message from CloudWatch logs (e.g., "AccessDeniedException when trying to put object to S3 bucket"). Claude can analyze the IAM policy for missing permissions (e.g.,s3:PutObject), identify misconfigured environment variables, or spot issues with handler paths, memory allocation, or timeout settings in the deployment configuration, bridging the gap between application code and cloud infrastructure.
Limitations and Ethical Considerations: Where Claude Excels and Where Human Oversight is Paramount
While our Claude Code debugging partner is incredibly powerful, it's not a magic bullet. Understanding its limitations is crucial:
- Lack of Real-time Environment Access: Claude cannot execute your code, interact with live systems, or observe runtime behavior directly. Its analysis is confined to the textual information you provide.
- Hallucination and Plausible-sounding Errors: Like all LLMs, Claude can sometimes generate incorrect but convincingly worded answers. Developers must critically evaluate and rigorously test all suggestions.
- Context Window Limits: While continually improving, there are practical limits to how much code and context can be provided in a single prompt. Very large, interconnected codebases still require human navigation and strategic prompting.
- Sensitivity to Prompt Wording: The quality of Claude's output is directly proportional to the clarity and specificity of your input prompt.
- Ethical Considerations:
- Data Privacy: Exercise extreme caution when sharing sensitive, proprietary, or customer-specific code and data with external AI models. Be aware of the AI service's data retention and usage policies.
- Bias and Fairness: If trained on biased code or historical data, the AI might inadvertently perpetuate those biases in its suggestions or problem identification.
- Over-reliance: Developers should not become overly reliant on AI to the detriment of developing their own critical debugging skills. AI is a tool to augment, not replace, human expertise and judgment.
- Accountability: Ultimately, the human developer remains fully responsible and accountable for the code's correctness, security, and ethical implications.
The Future of Debugging: Empowered by AI Partnership
Recap: The Transformative Impact of an AI Debugging Partner
We've journeyed through the frustrations of traditional debugging and witnessed firsthand the transformative impact of incorporating an AI, specifically a Claude Code debugging partner, into the development workflow. This intelligent collaboration doesn't just make debugging faster; it makes it smarter. Claude offers:
- Accelerated Diagnosis: Quickly pinpointing probable causes, saving invaluable developer time.
- Enhanced Understanding: Providing clear explanations and deep reasoning behind bugs and their fixes, fostering learning.
- Proactive Quality Assurance: Assisting in code review and refactoring, catching potential bugs before they even manifest.
- Intelligent Collaboration: Acting as a knowledgeable, conversational partner throughout the iterative debugging process, making problem-solving less isolating.
From unraveling subtle logic errors in Python data processing to tackling complex state management issues in React and even debugging intricate infrastructure misconfigurations, Claude demonstrates a versatile and potent capability to assist across the entire software stack.
Evolving Your Workflow: Integrating AI Seamlessly
To truly harness the power of AI in your development practice, consider these evolutions in your workflow:
- Treat AI as a "Smart Peer": Engage Claude as you would a highly knowledgeable colleague—for brainstorming, code review, and deep problem-solving, rather than just a glorified search engine.
- Master Prompt Engineering: Invest time in honing your ability to craft effective, context-rich, and highly specific prompts. This is the new superpower that unlocks AI's full potential.
- Combine Tools Strategically: Leverage AI in conjunction with your existing arsenal of traditional IDE debuggers, robust logging, and comprehensive monitoring tools. Each tool has its strengths; use the right one for the right facet of the problem.
- Continuous Learning and Verification: Always critically test and verify AI-generated solutions. Use the AI's suggestions not just as a fix, but as a learning opportunity to understand new concepts, unfamiliar design patterns, or alternative approaches.
- Establish Clear Guidelines: For development teams, establish clear internal guidelines on what type of code or data can be shared with AI models, especially external ones, to mitigate potential privacy and security risks.
What's Next for AI in Software Development: An Intelligent Frontier
The trajectory for AI in software development is unequivocally towards an increasingly intelligent, integrated, and autonomous frontier:
- Deep Integration into IDEs: Expect AI capabilities to become even more seamlessly embedded within Integrated Development Environments, offering real-time suggestions, proactive error detection, and even automated fix attempts as code is being written, moving beyond static analysis towards dynamic, context-aware assistance.
- Proactive Anomaly Detection: Future AI systems will evolve beyond merely reacting to errors. They will proactively identify anomalies in runtime behavior, predict potential failures, and suggest preventative measures before any impact to users, leveraging advanced machine learning on system metrics.
- Self-Healing Systems: In the long term, AI could pave the way for genuinely self-healing software systems that not only detect and diagnose issues but also implement and deploy verified fixes autonomously, particularly for well-defined problem patterns.
- Complex System Understanding: As software architectures become more distributed and complex, future AI models will be better equipped to understand intricate architectural diagrams, interact with APIs across different services, and reason about cascading failures in microservice environments.
- Multimodal AI for Debugging: The ability to process not just code and text but also visual elements (like UI screenshots for frontend rendering bugs) or even audio (for voice-activated debugging assistance) could open entirely new dimensions for AI in problem-solving.
The future of debugging isn't about human developers being replaced; it's about empowering them with an intelligent, ever-present, collaborative partner that significantly reduces the toil, accelerates innovation, and elevates the overall quality and reliability of software. Our journey with AI, starting with powerful tools like Claude, is only just beginning, promising an exciting and intelligent frontier ahead.
FAQ
Can Claude Code actually run and execute my code to find bugs?
No. Claude reasons over the code, logs, and error messages you provide as text — it doesn't have direct access to a live runtime, memory, or call stack. It's strongest at explaining why a bug might exist; an IDE debugger is still the tool for observing where it happens during actual execution.
Is Claude better than a traditional IDE debugger?
They're complementary, not competing. An IDE debugger excels at runtime analysis — stepping through execution and inspecting variables at a specific point. Claude excels at static, conceptual reasoning — spotting logic flaws, architectural issues, or API misunderstandings once you describe the symptom and provide the relevant code.
What information should I give Claude to debug effectively?
Concrete evidence, not vague descriptions. A specific log line ("filtered_list was [0.0, 5.0, 10.0] but should have been [5.0, 10.0]") gives Claude far more to work with than a general statement like "the average is wrong."
Can I trust Claude's suggested bug fixes without testing them?
No. Like any LLM, Claude can produce plausible-sounding but incorrect explanations or fixes. Every suggestion should be critically evaluated and tested before being trusted, especially for anything touching production code.
Is it safe to share proprietary code with an AI debugging assistant?
Exercise caution. Sharing sensitive, proprietary, or customer-specific code with an external AI model carries data-privacy risk, and teams should have clear guidelines on what can and can't be shared, based on the AI provider's data retention and usage policies.
What can't Claude do when debugging?
It can't observe your running application directly, it has practical limits on how much code and context fit in one conversation, and the quality of its help depends heavily on how clearly you describe the problem. It's an augmentation to human debugging skill, not a replacement for it.