Note on Transparency: This article was generated with the assistance of Artificial Intelligence to provide a comprehensive and up-to-date overview of the discussed topic.
The symptom: revenue down, traffic geography flipped
A few weeks ago I noticed two things at once on this blog: AdSense revenue had fallen to a small fraction of what it used to earn, and Google Analytics showed my traffic had quietly shifted — a huge share of it now geolocating to Singapore instead of the US audience I remembered having. Two anomalies, same timeframe. The obvious first move is to assume they're the same story. That assumption turned out to be wrong, and untangling why took a full debugging session — not of code, but of a business metric, using the same discipline you'd apply to a production incident.
This is a walkthrough of that session: the hypotheses I tested, the ones that were dead ends, and the one that actually explained it — which turned out to be sitting in git log the whole time.
Dead end #1: blaming the hosting region
The site is deployed on Vercel with the project region set to Singapore, so the geography shift was the first suspect. It's a reasonable theory and it's wrong for a specific, checkable reason: Google Analytics geolocates visitors by the IP address that hits Google's own collection servers directly from the browser — it has nothing to do with where your application server runs. On top of that, this site is almost entirely statically generated; the build output showed the homepage, the blog index, and every post as static or SSG routes, served from Vercel's global CDN regardless of the configured function region. A reader in the US loading a blog post isn't routing through Singapore first. Ruled out.
Dead end #2 (partially): a missing consent banner
Next theory: no cookie-consent management platform on the site, which can cause Google to restrict ad serving for EU/UK visitors. I checked the code — there really was no CMP wired in anywhere. I added Google's Funding Choices tag as a real fix. But when I checked the AdSense dashboard's Privacy and messaging panel, there was already a Google-auto-created consent message, published and active, dated back over a year. It predated the revenue drop entirely. A genuine gap, worth fixing regardless — but not the cause of this problem.
Two hypotheses down. Neither explained the timing.
The real investigation: what the traffic actually looked like
This is where guessing stopped and evidence started. I pulled a full Google Analytics export — city-level breakdown, session source/medium, engagement metrics — and the pattern was hard to miss.
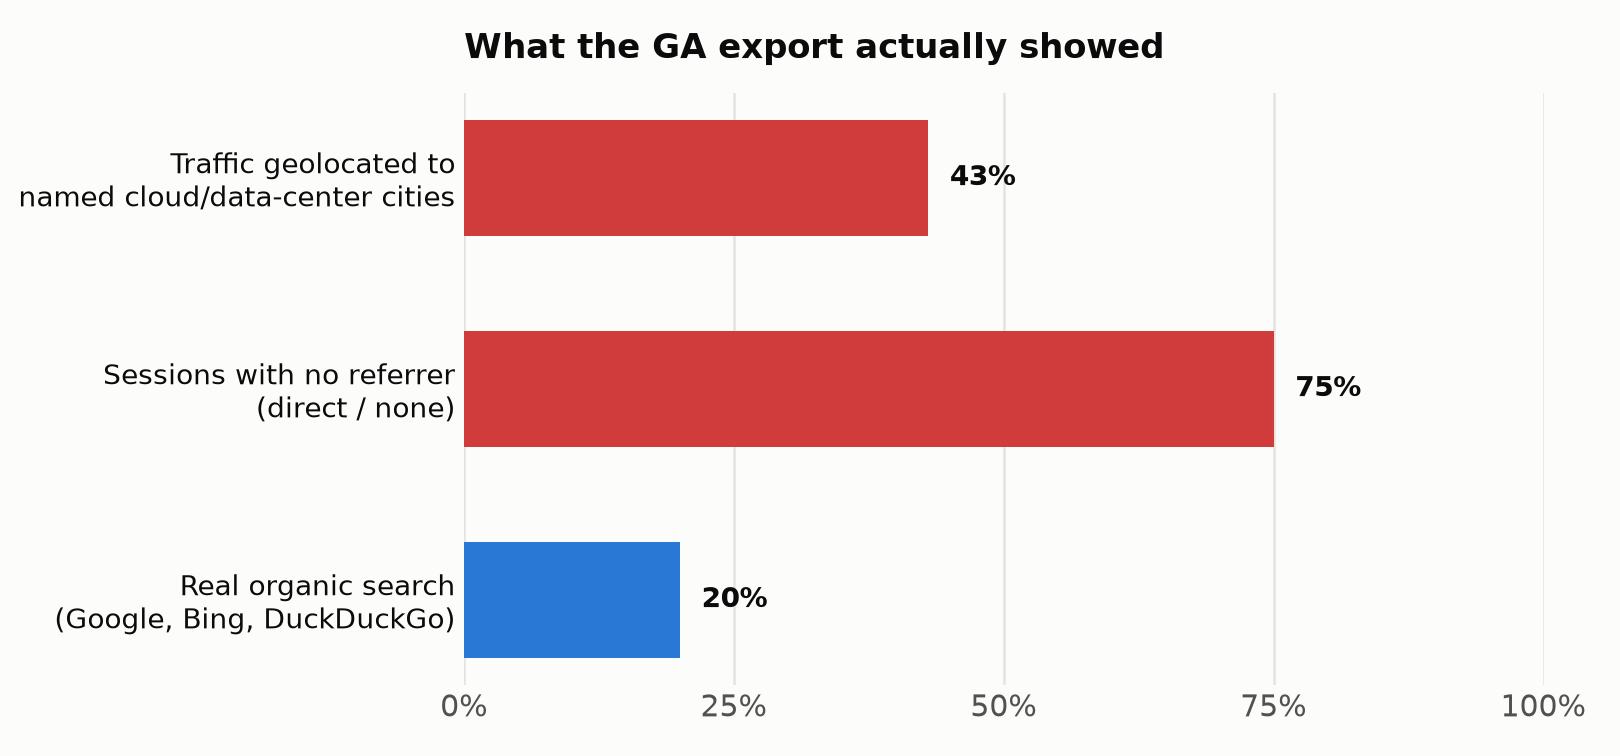
Singapore wasn't just the top city — it dominated, at multiples of the next-largest city. But the real tell was further down the list: Ashburn, Virginia (essentially "AWS us-east-1"), Council Bluffs, Iowa and The Dalles, Oregon (two of Google's own named data centers), and an oddly large share of traffic from mainland Chinese cities that Google Analytics' collection domain is normally blocked from reaching without a VPN. Almost half of all recorded "visitors" geolocated to literal cloud-hosting infrastructure, not residential or mobile networks. Layer on top of that: three-quarters of all sessions arrived with no referrer at all, and across a full year, days with any returning visitor were the exception, not the rule. That combination — data-center cities, no referrer, no repeat visits — is a well-known fingerprint for automated, headless-browser traffic, not a shift in real readership.
Before concluding "it's all bots," I checked two more things to avoid over-fitting the theory. AdSense's Policy Centre showed no active restriction on the account — so this wasn't Google throttling ad delivery in response to invalid traffic. And the per-country earnings report showed Singapore traffic did earn real, non-zero revenue, at a rate broadly in line with other Asia-Pacific markets — not the near-zero signature of pure bot traffic. So the honest conclusion was more nuanced than "bots stole my revenue": there's real bot pollution inflating the analytics numbers, and there's a real, lower-value-but-genuine audience underneath it. Bot traffic was a contributing factor, not the whole story, and notably it didn't explain why the drop had a specific shape over time rather than being a smooth decline.
The breakthrough: the shape of the decline
The traffic analysis explained what was happening in the present, not when it started or why revenue had such a specific pattern. So I pulled a month-by-month earnings trend covering the entire history of the site.
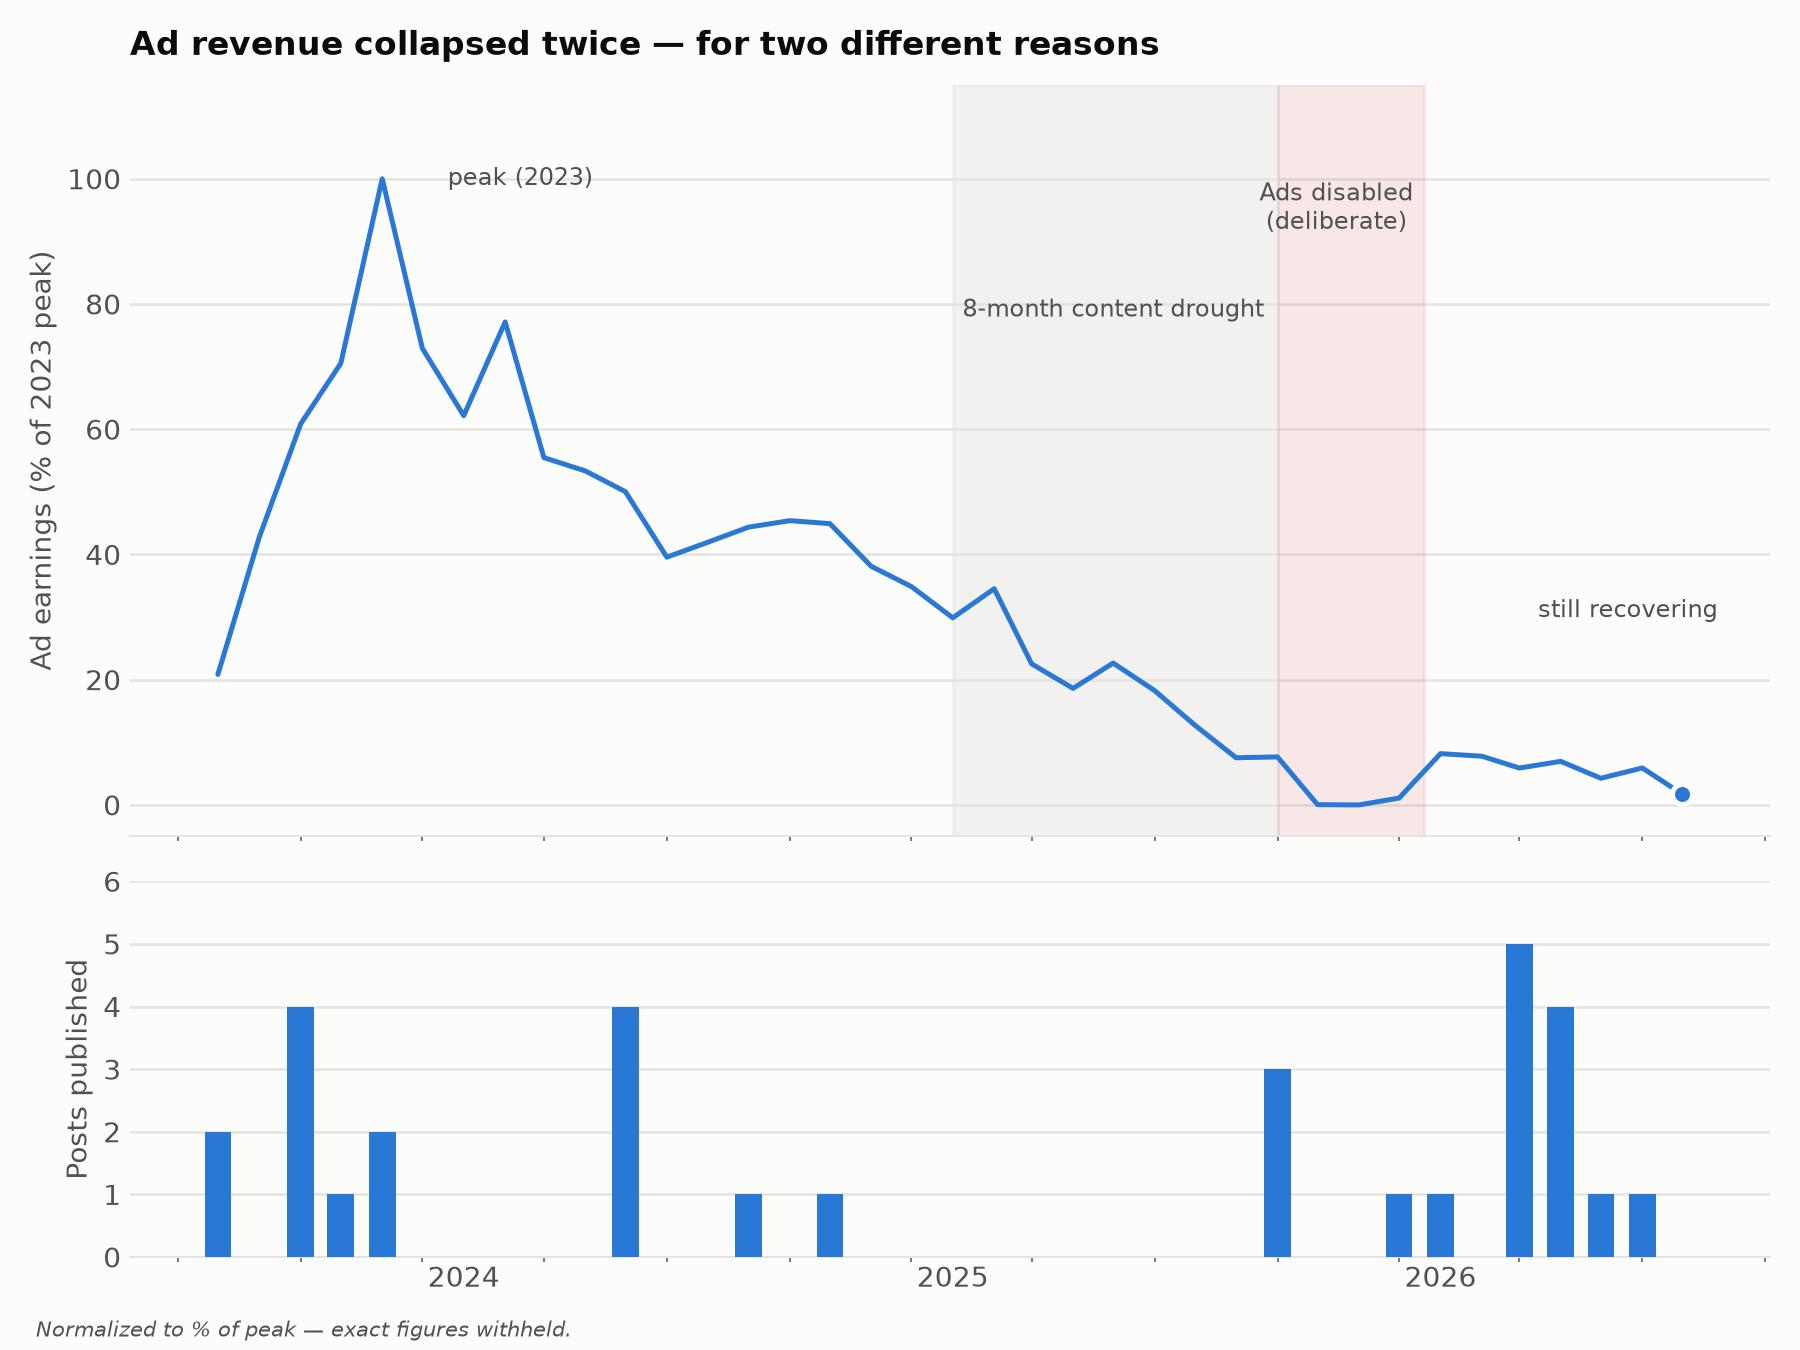
That chart changes the entire investigation. Revenue climbed to a peak, then declined steadily for well over a year — a slow bleed, not a cliff, and notably one that started before any Singapore traffic surge. Then there's an unmistakable feature: three consecutive months where earnings drop to essentially zero, followed by a partial recovery to a new, much lower plateau that it's still climbing out of. A smooth decline doesn't produce a flat-zero plateau for three exact months and then resume. That shape is a signature of something being switched off and later switched back on — not a gradual audience or bot-quality drift.
Git archaeology: the commit history had the answer
With a specific three-month window to investigate, the fastest way to check "did something get switched off" is the version history of the site itself:
git log --since="2025-08-01" --until="2025-12-15" --date=short --pretty=format:"%ad %h %s"The output told the whole story in plain English, no bisecting required:
Sep 20  Removed ads references and added consulting text
Sep 20  Removing unnecessary ads component
Sep 27  Removing google ads compoenent
        [ ~2 months with no commits at all ]
Nov 27  Upgrade Next.js and React versions, add new font system
Dec 19  New post, multi tag support and google ads placement
Three commits in September, all doing the same thing: removing the ad component from every page. One commit in December, restoring it. That is exactly the three-month zero-earnings window from the chart, explained by a plain-language commit message, not a subtle logic bug. The actual reason turned out to be a deliberate, reasonable decision: a reader had emailed to say the site felt overloaded with ads and they'd left because of it, and that feedback was enough to turn ads off entirely for a few months while the focus shifted back to just writing.
The second, quieter root cause
The commit history fully explained the three-month cliff, but it didn't explain why revenue — even after ads came back in December — never returned to anywhere near its 2023 peak. That required going one layer deeper: checking how often new content had actually been published, using the same tool.
git log --diff-filter=A --name-only --format="COMMITDATE %ad" --date=format:"%Y-%m" -- src/_posts/*.mdxThe bottom panel of the timeline chart above is that data. After a healthy publishing rhythm through 2023, output slowed to almost nothing in 2024, and then stopped completely for eight straight months in early-to-mid 2025 — no new posts at all. That drought predates the ads-off period by months and is the far more plausible explanation for the underlying traffic and revenue decline: stale content ranks worse, gets crawled less often, and accumulates fewer backlinks over time. The three-month ads-off window landed on top of an already-weakened base and zeroed it out completely; the slow bleed before and after it was the content gap, not bots and not ads configuration.
The actual fix wasn't a code change
Once the real shape of the problem was clear — inconsistent publishing being the dominant, long-running cause, with a resolved technical decision layered on top — the fix wasn't a patch to the codebase. It was removing the friction that caused an eight-month drought in the first place: a lightweight pipeline where a topic idea can go from "a thought I had" to a drafted, SEO-checked, ready-to-review post with a single command, instead of requiring a from-scratch writing session every time. Consistent output, not a bug fix, is what actually moves this number.
What this session was really about
None of the individual techniques here are exotic — reading a GA export, checking a dashboard's policy page, running git log with a date range. What made the difference was the order: cheap, falsifiable hypotheses first (hosting region, consent config), each one actually checked against evidence rather than assumed, before reaching for a more elaborate theory (invalid traffic). And when the data pointed at a specific time window rather than a gradual trend, the fastest path to ground truth wasn't more analytics — it was the plain-English audit trail already sitting in version control. A business metric is a system like any other. It's worth debugging like one.
Bisecting Bugs: What git bisect Teaches You About Debugging
Reading Stack Traces Like a Detective